
Too Many Reports, Too Little Insight
Teams drown in spreadsheets and still can't answer simple questions.
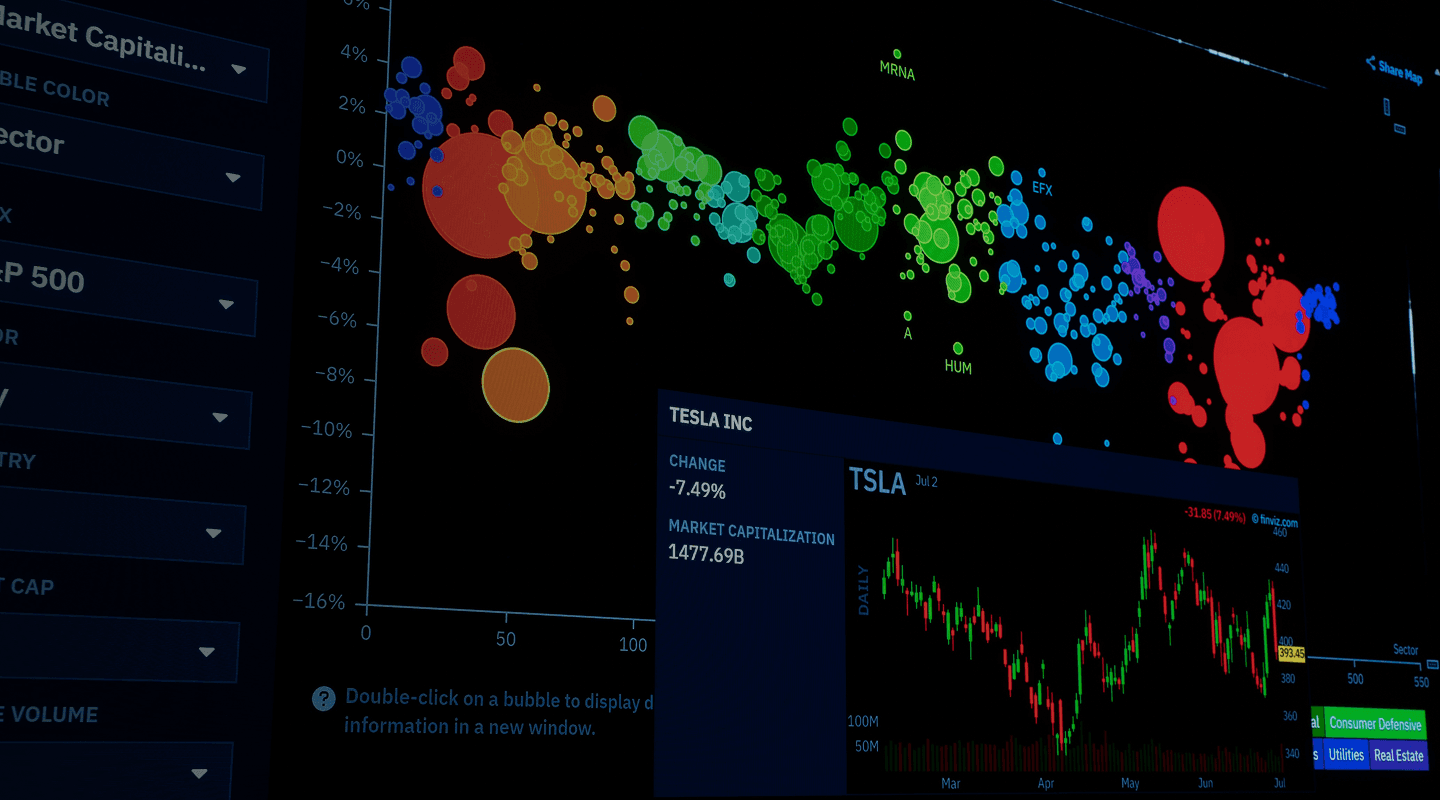
Data Analytics & Business Intelligence
We build dashboards and reports your leadership actually uses, built on clean data and clear metrics, so every team can see what's happening and act on it.
Challenges
Most teams have dashboards. Few trust them enough to make decisions with them.
Teams drown in spreadsheets and still can't answer simple questions.

Finance, sales and operations each report different figures.

Analysts spend hours pulling and cleaning data by hand every week.

Reports built without users in mind go unused.

Book A Call

Service
As a data analytics company, we offer BI consulting services from strategy to dashboards your team uses every day.
Clear, interactive dashboards for leadership, sales, finance and operations.

Set up, build and optimize Power BI reports and data models.

Design and build Tableau dashboards that make data easy to explore.
Define the right metrics and make sure every team calculates them the same way.

Give teams the tools and training to answer their own questions.
Practical, affordable analytics for growing teams without a data department.
Process
A three-phase approach from questions to dashboards people actually use.

Timeline: 1-2 weeks
We meet your teams, define the key questions and metrics, and review your data sources.
Deliverables:

Timeline: 3–6
We model the data and build dashboards, testing them with real users as we go.
Deliverables:

Timeline: Weeks 6+ and ongoing
We train your teams, track adoption and keep improving reports as needs change.
Deliverables:
Benefits

Answers in seconds instead of waiting days for a report.
Every team uses the same metrics and definitions.

Automated dashboards replace weekly spreadsheet work.

Teams see their goals and progress in one place.

Trends and patterns that help you plan ahead.
Use Cases


Analytics for care operations and outcomes We build analytics for HealthTech teams that need visibility into both operational performance and patient-facing outcomes.
 Track patient intake, wait times, and care-coordination metrics.Build compliance-aware dashboards that respect data sensitivity.Surface operational bottlenecks across clinical workflows.Report on platform usage and engagement for patient-facing tools.
Case Studies
Projects Of Novatore Solutions
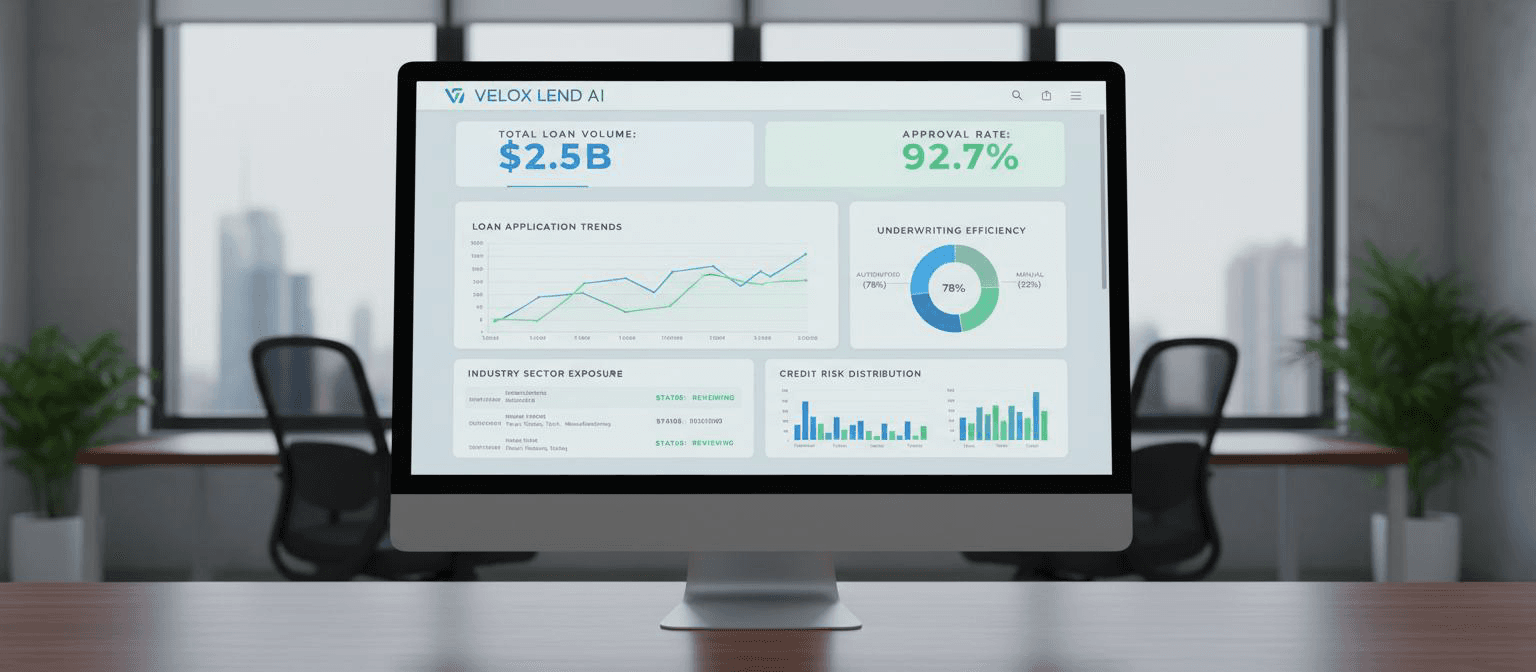
Novatore contributed to OneH2's logistics solution, a React and Node.js platform that helps energy companies manage fleets, supply chains, and 24/7 hydrogen fuel demand, giving operations teams visibility into moving assets and delivery performance.
OUTCOME
Operational dashboards giving fleet and supply-chain teams real-time visibility into assets and delivery performance.

Challenge: Managing fleets, deliveries, and 24/7 hydrogen fuel demand requires teams to track constantly changing operational data. Without centralized, real-time visibility, it becomes difficult to monitor asset movement, delivery performance, and supply-chain operations efficiently.
Solution: Novatore contributed to a React and Node.js platform that brought fleet, supply-chain, and delivery data into a unified operational view. Real-time dashboards gave teams a clearer picture of moving assets, delivery activity, and overall logistics performance.
Result: Operations teams gained a shared, up-to-date view of fleet and delivery performance, making it easier to monitor assets, identify operational issues, and respond to changing logistics demands.
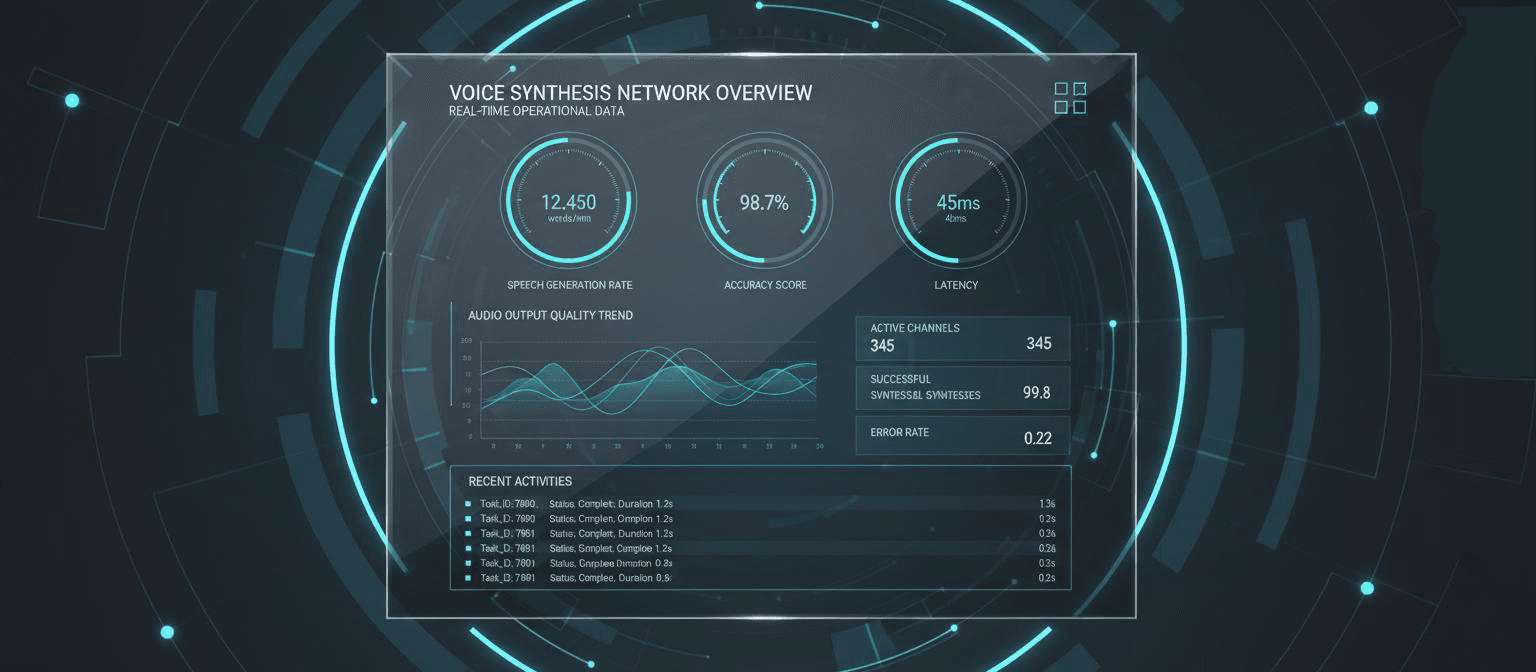
Novatore supported reporting for Milton & King, a WordPress and MySQL e-commerce platform for a modern wallpaper and fabric brand, helping the business track catalog performance and sales trends as the storefront grew.
OUTCOME
Sales and catalog performance visibility supporting product and merchandising decisions as the storefront scaled.
Challenge: As Milton & King’s e-commerce storefront expanded, tracking product performance and sales trends across a growing catalog became increasingly important. Without clear reporting, merchandising and business teams had less visibility into which products were driving performance and how sales were evolving.
Solution: Novatore supported reporting across the WordPress and MySQL e-commerce platform, bringing catalog and sales data into a clearer view of business performance. The reporting helped teams monitor product-level trends and better understand sales activity as the storefront scaled.
Result: Milton & King gained greater visibility into catalog performance and sales trends, giving teams the insights needed to evaluate product performance, identify trends, and make more informed merchandising decisions.
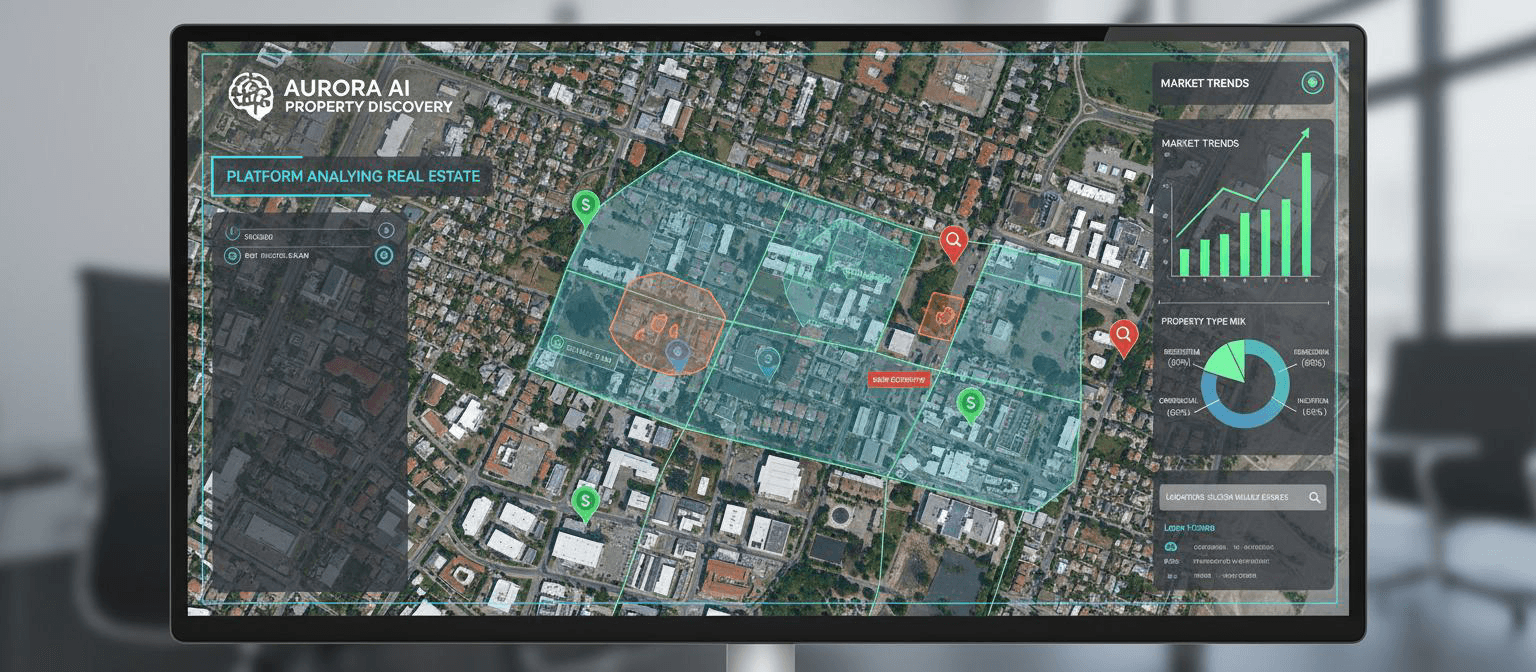
Novatore built Souq of Qatar on React, an e-commerce platform designed to consolidate product and service information in an easy-to-read format so buyers can compare options and make informed purchase decisions across categories.
OUTCOME
Consolidated product and service data presented clearly enough for buyers to compare options without extra research.
Challenge: Fragmented information made product comparisons harder With products and services spanning multiple categories, buyers had to navigate different sources to find the information needed to compare options. This made it harder to evaluate choices quickly and confidently.
Solution: A centralized platform for clearer product discovery Novatore built Souq of Qatar on React to consolidate product and service information into an easy-to-read platform. The solution organized key details in a consistent format, making it easier for buyers to explore and compare options across categories.
Result: More informed buying decisions with less research Buyers gained a clearer view of available products and services, allowing them to compare options more efficiently and make informed purchase decisions without relying on extensive additional research.
Tools & Technologies
Our strategy engagements are grounded in the same tools our delivery teams use, so roadmaps reflect what's actually achievable with today's AI platforms.


FAQ
What teams usually ask before starting a BI project.
Business intelligence (BI) is the process of collecting, organizing and presenting business data in dashboards and reports. It helps leaders and teams see performance, spot trends and problems early, and make decisions based on facts instead of guesswork, often saving hours of manual reporting every week.
Power BI is usually more affordable and fits naturally if your company already uses Microsoft 365 and Azure. Tableau is known for powerful, flexible visualizations and works well across many data sources. The better choice depends on your existing tools, budget, data complexity and who will build and use the dashboards.
BI implementation typically costs $25 To $49 Per Hour, depending on the number of data sources, dashboards and users. A few dashboards on clean data sit at the lower end, while company-wide BI with data modeling, many sources and training costs more. Software licenses are separate. We give a clear estimate after a free call.
Not always. Small setups can connect directly to sources, but a warehouse makes reporting faster and more reliable as you grow.
Yes. We review existing reports, fix data issues and redesign them for clarity.
Yes. We train your team and document everything so they can make changes themselves.
Yes. We scale BI projects to fit smaller teams and budgets.
Your Go To Business Partner

We combine strategy and delivery to build what actually ships, from roadmap to production.
Strategists, engineers, and QA specialists work as one team to turn plans into software fast.

React, Next.js, Node.js, Flutter, and Laravel expertise, paired with modern AI and cloud tooling, covers the full delivery lifecycle.

We work inside the timelines, communication norms, and compliance expectations our North American and UK clients require.
38+ products delivered from concept to production across HealthTech, FinTech, retail, and SaaS, with proven experience.

We Are Just One Click Away
Book a free 30-minute call with Novatore Solutions. No roadmap pitch, no build commitment, just straight answers
CONTACT US
Have a challenge worth solving or an idea worth building? Let's explore it, shape it, and turn it into a solution that creates real impact.
